Introduction
Over the last ten years fragment-based screening has evolved to be a promising strategy in drug discovery. Fragments are defined as molecules with a molecular weight between 100 and 300 Da, and are considered substructures of drug-like substances. Such fragments typically possess affinities from the micromolar to millimolar range. The powerful label-free analysis tool surface plasmon resonance (SPR) technology (described in detail in the Applications & Technologies section of Bio-Rad.com) is ideally suited for fragment-based drug discovery as it combines high sensitivity, high throughput, and low sample consumption and does not require the use of fluorescent labels.
In this experiment we followed the steps outlined below to establish the affinity of 18 small molecules by injecting 11 different concentrations of each small molecule over just two injection cycles:
- A small subset of fragments was derived and expanded from a primary biochemical assay.
- Fragments were screened by SPR alongside a set of small molecules.
- The protein target, which was a DNA repair protein, was amine coupled to a hydrophilic 3-D matrix.
- Protein activity was verified by observation of binding to four positive controls that are known binders.
- The affinity of the target ligand for these four positive controls was then measured, followed by that of the fragments, as an orthogonal assay to confirm or rule out “hits” from the primary biochemical screening.
These 18 small molecules were more developed compounds and were selected based on potency from the biochemical assays.
In drug discovery, initial hits are most frequently optimized by fragment evolution. In this approach the fragment is modified by the addition of substituents, leading to a boost in activity. Here the affinity of such more developed small molecules for the protein target is quickly and reproducibly measured by SPR.
Methods
For fragment screening, the protein target, a 61 kD DNA repair protein, was amine coupled to two vertical flow channels (ligand channels) of a ProteOn™ GLH chip at 25°C. Following the amine coupling step, four positive controls, labelled A, B, C, and D, and a negative control were injected in the horizontal flow channels (analyte channels). Positive controls at a single concentration were injected first to confirm that analyte binding to the target surfaces was occurring, and then the analytes (fragment library members) were injected. The experiment was then repeated on the same GLH sensor chip by amine coupling the protein target to the surfaces in two other vertical flow channels and then injecting the same analytes in the horizontal flow channels. The fragments showing positive results on all four protein surfaces were reported as hits in this study.
For affinity measurements, the protein target was amine coupled to three different vertical flow channels and each of the analyte samples was prepared in a dilution series of 11 different concentrations and injected using only two injection cycles. The entire sensorgram set for each analyte was fitted for kinetic constants ka and kd using the Langmuir model, and the steady state response of the small molecules was measured and fitted for the equilibrium constant KD value. In total 18 small molecules were injected over the protein target surfaces and the KD values determined.
Results
Protein Activity of the Positive Controls
The measured KD values for the positive controls are shown in Table 1.
Table 1. The KD values of the positive controls A, B, C, and D to the protein target.
|
|
MW, Da
|
Rmax, RU
|
KD, µM
|
Theoretical Rmax, RU
|
Protein activity, %
|
|
A
|
343.4
|
52
|
0.69
|
110
|
47
|
|
B
|
341.4
|
77
|
0.13
|
110
|
70
|
|
C
|
327.4
|
76
|
0.34
|
105
|
72
|
|
D
|
352.4
|
59
|
0.23
|
113
|
52
|
Based on the 19,000 RU immobilization level of the protein target, a 200 Da fragment would be expected to give a signal of at least 33 RU, assuming a 50% protein activity on the surfaces. The results shown in Table 1 indicated that the protein activity was 50% or higher, confirming that the performance of the protein-immobilized surfaces was adequate to measure fragment binding to the protein target.
Fragment Screening
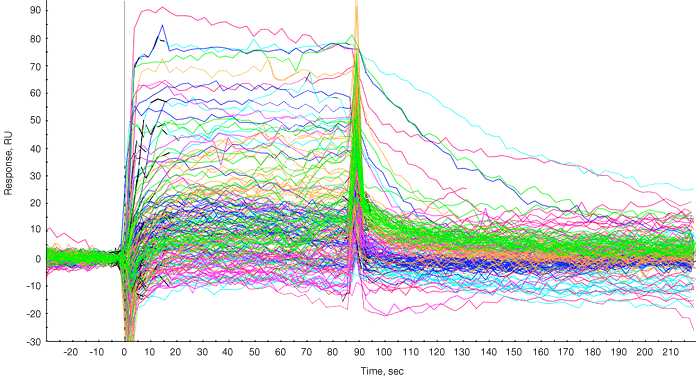
Following subtraction of bulk effects via a channel reference, the responses of the fragments and positive controls are overlaid as shown in Figure 1.

Fig. 1. Sensorgram processing. Sensorgram from each fragment is overlaid on the sensorgrams from the two positive controls injected at the end of the panel of fragments. The sensorgrams were processed for baseline alignment and reference subtraction.
A report point was selected in the steady state phase and a plot of compound name versus response during the report point was generated. Typically a threshold value is set (for example, 40 RU), and compounds giving responses of 40 RU or greater are considered hits and are shortlisted for further investigation. The molecular weights of fragments that “hit” covered 185 to 340 Da (Figure 1).
The maintenance of protein activity was checked during the experiment. After each analyte set was completed, a positive control was rerun and the KD and Rmax values were compared to the initial values. There was negligible loss of activity of the protein target during each of the analyte set runs (data not shown).
Kinetic analysis (ka, kd, calculated KD = kd/ka) and equilibrium analysis (measured KD)
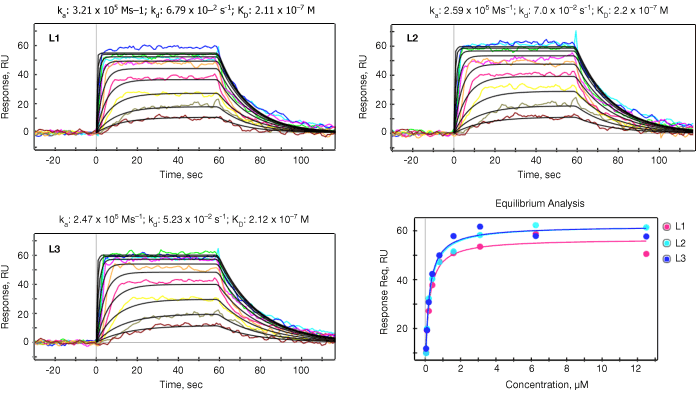
Both kinetic and equilibrium analyses were carried out for all 18 small molecules for the purpose of verifying the SPR data reliability. SPR data reliability is typically evaluated by the consistency between calculated KD (KD=kd/ka) from kinetic analysis and measured KD from equilibrium analysis. The ka, kd, and KD values are summarized in Table 2 and representative data for one of the small molecules (#3) is shown in Figure 2.

Fig. 2. Kinetic analysis. The data sensorgrams were collected by injection of up to 12 different concentrations of small molecule #3 over three ligand channels (L1, L2, L3). Concentrations are 12.5 to 0.05 µM (traces top to bottom) in two fold steps. The sensorgrams were processed for baseline alignment and reference channel subtraction. Kinetic analysis was performed by globally fitting the data to the Langmuir 1:1 model, with the black lines representing the global fit to the model. In the lower right panel the response at equilibrium was measured for each concentration and then fitted to the 1:1 equilibrium model from which KD was derived. The red, blue and cyan binding isotherms correspond to the three different vertical flow channels shown as in the other figures in this panel. RU, response units.
Table 2. Summary of data from kinetic and equilibrium analysis for each small molecule studied.
|
Compound Number
|
MW
|
Highest Concentration Used, µM
|
Kinetic Parameters
|
Equilibrium Parameter KD µM,
n = 3 avg |
||
|
ka (M-1s-1)
|
kd (s-1)
|
KD = kd/ka µM,
n = 3 avg |
||||
|
1
|
343.3
|
25
|
1.1 x 10⁵
|
1.5 x 10⁻¹
|
1.44 ± 0.23
|
1.07± 0.08
|
|
2
|
341.38
|
12.5
|
3.2 x 10⁵
|
2.5 x 10⁻²
|
0.08 ± 0.00
|
0.09 ± 0.00
|
|
3
|
327.35
|
12.5
|
2.9 x 10⁵
|
5.8 x 10⁻²
|
0.20 ± 0.01
|
0.21 ± 0.01
|
|
4
|
352.36
|
12.5
|
4.4 x 10⁵
|
4.5 x 10⁻²
|
0.10 ± 0.01
|
0.09 ± 0.00
|
|
5
|
309.34
|
12.5
|
4.4 x 10⁵
|
2.5 x 10⁻²
|
0.57 ± 0.13
|
0.53 ± 0.05
|
|
6
|
269.28
|
100
|
5.7 x 10⁴
|
6.6 x 10⁻¹
|
12.0 ± 4.1
|
13.0 ± 4.6
|
|
7
|
306.34
|
50
|
2.2 x 10⁵
|
2.8 x 10⁻¹
|
1.27 ± 0.08
|
1.21 ± 0.08
|
|
8
|
281.29
|
25
|
5.7 x 10⁵
|
3.9 x 10⁻¹
|
0.68 ± 0.05
|
0.67 ± 0.05
|
|
9
|
295.36
|
25
|
3.7 x 10⁵
|
2.2 x 10⁻¹
|
0.60 ± 0.04
|
0.55 ± 0.06
|
|
10
|
297.37
|
100
|
1.1 x 10⁵
|
8.2 x 10⁻¹
|
7.9 ± 1.7
|
6.7 ± 1.3
|
|
11
|
280.34
|
100
|
1.6 x 10⁵
|
4.7 x 10⁻¹
|
2.9 ± 0.4
|
2.9 ± 0.7
|
|
12
|
382.46
|
100
|
9.0 x 10⁴
|
3.7 x 10⁻¹
|
4.25 ± 0.35
|
4.0 ± 0.3
|
|
13
|
334.35
|
50
|
3.1 x 10⁵
|
1.0 x 10⁻¹
|
0.25 ± 0.01
|
0.22 ± 0.02
|
|
14
|
367.42
|
100
|
2.6 x 10⁴
|
3.7 x 10⁻¹
|
11.5 ± 1.6
|
9.5 ± 1.2
|
|
15
|
381.45
|
100
|
1.5 x 10⁵
|
4.9 x 10⁻¹
|
3.3 ± 0.2
|
2.8 ± 0.1
|
|
16
|
295.31
|
100
|
5.2 x 10⁵
|
1.5 x 10⁻¹
|
0.30 ± 0.03
|
0.31 ± 0.02
|
|
17
|
325.38
|
100
|
8.0 x 10⁴
|
3.1 x 10⁻¹
|
3.9 ± 0.3
|
3.5 ± 0.3
|
|
18
|
351.42
|
12.5
|
5.2 x 10⁵
|
5.8 x 10⁻²
|
0.11 ± 0.00
|
0.09 ± 0.01
|
Conclusion
The technique presented here provides a fast and reliable way of screening fragments and measuring the affinity of small molecules in drug discovery. Following the key steps provided in this example of small molecule analysis and fragment screening helps in adding controls at key relevant steps in drug screening, ensuring reliable SPR measurements. Results of the present study following this method provided reproducible KD measurement for 18 small compounds (269 to 367 Da). In conclusion, the following key steps ensure efficient fragment screening:
- Checking target molecule for determination of activity after amine coupling using its binding to positive controls.
- Establishing KD and Rmax values for positive controls for periodic checking of target activity.
- Using multiple independent vertical flow channels concurrently on the same chip for efficient generation of replicate data sets.
The ProteOn XPR36 protein interaction array system is covered by Bio-Rad patents, including U.S. patent numbers 8,111,400, 8,105,845, 7,999,942, and 7,443,507.
This product or portions thereof is manufactured and sold under license from GE Healthcare under U.S. patent numbers 5,492,840, 5,554,541, 5,965,456, 7,736,587, and 8,021,626, and any international patents and patent applications claiming priority.

