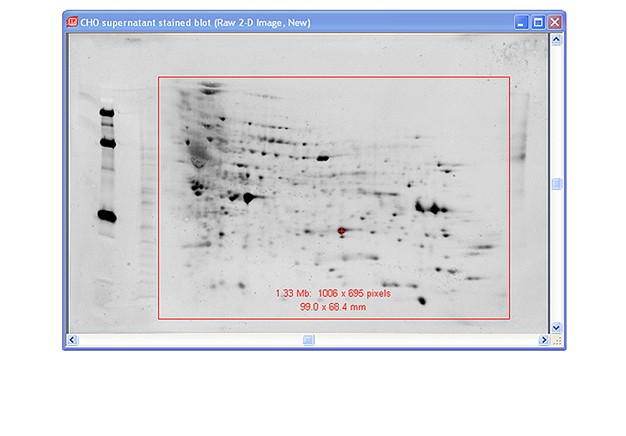
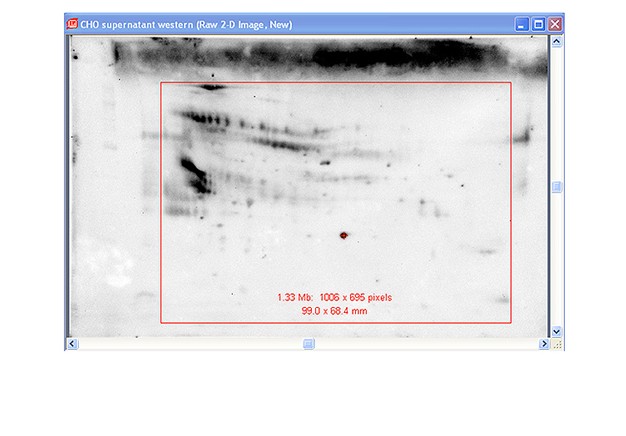
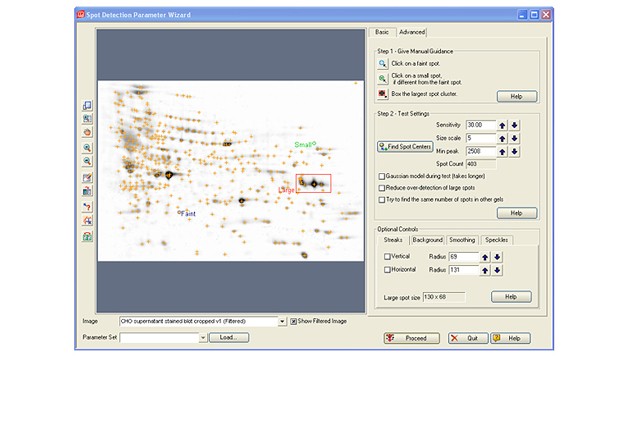
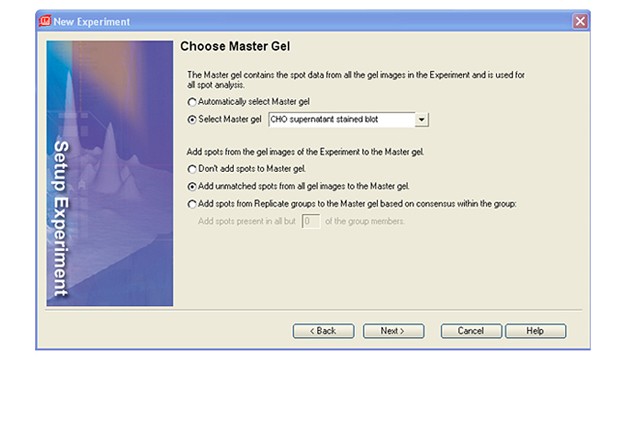
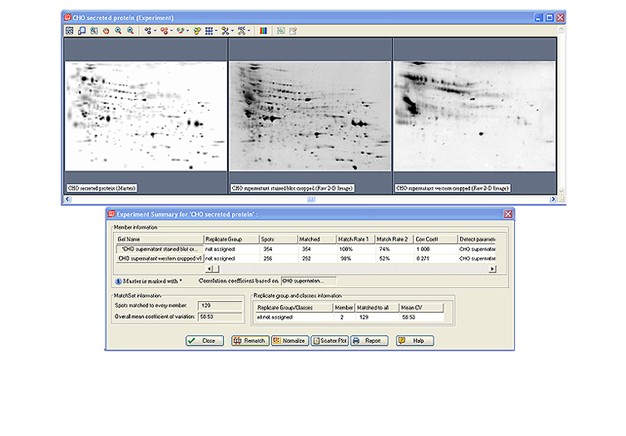
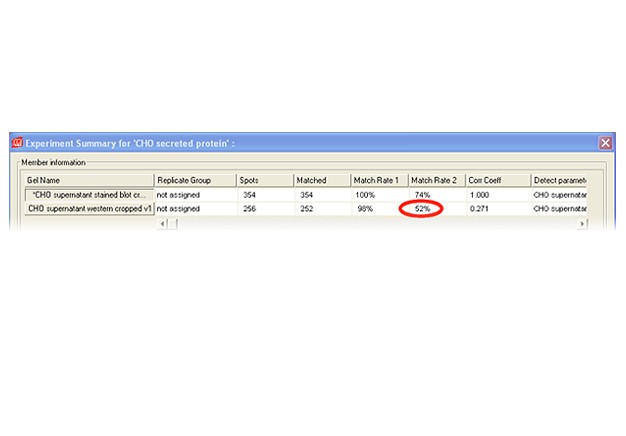
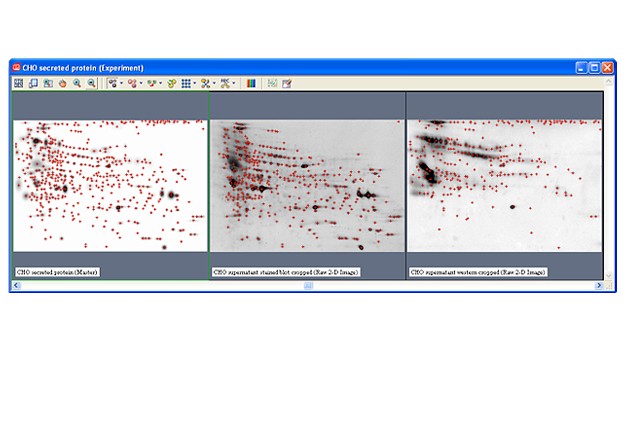
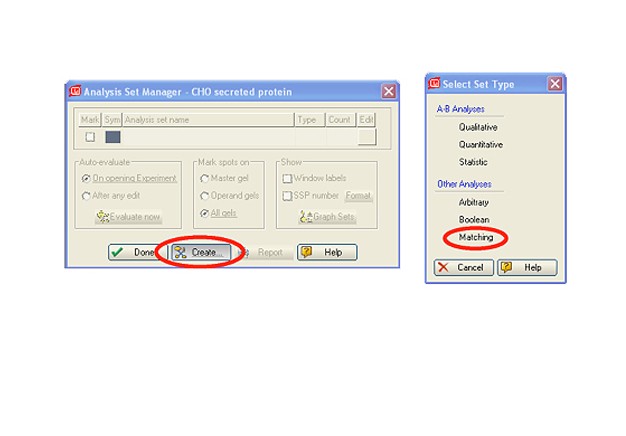
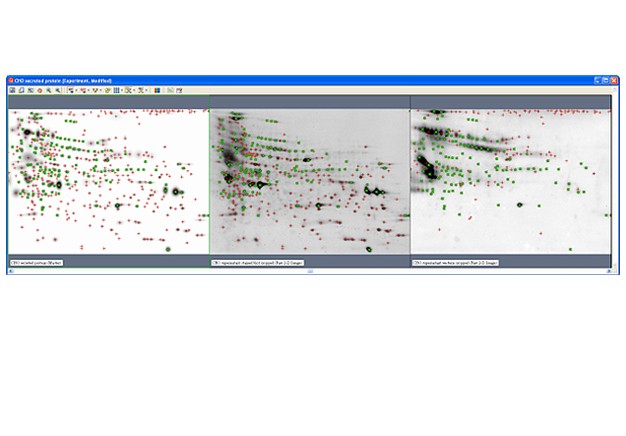
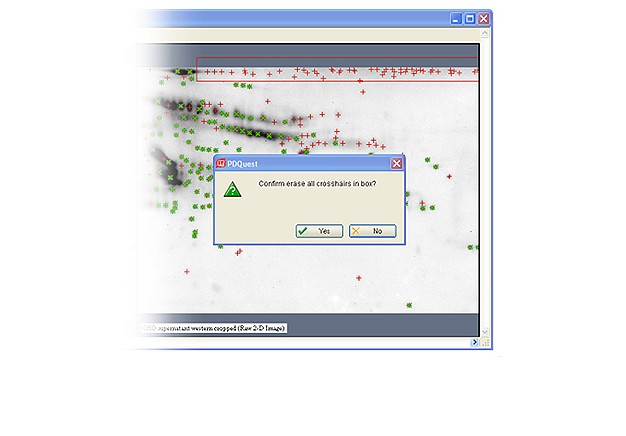
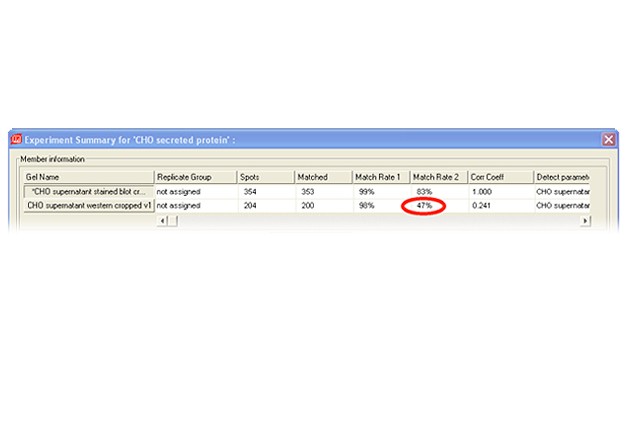
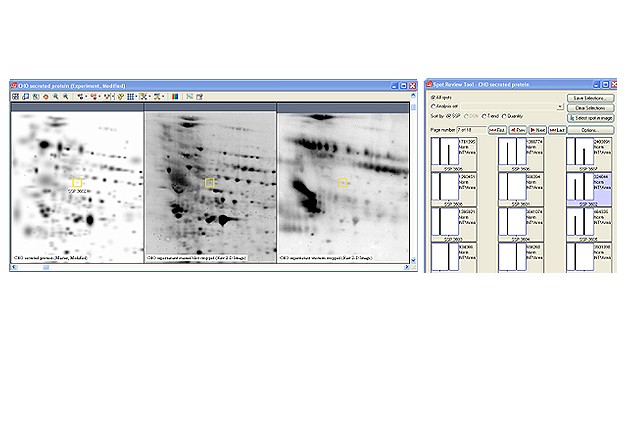
Two-dimensional (2-D) electrophoresis is a widely used gel-based method for separating protein mixtures by charge (isoelectric point) and size (molecular weight). After 2-D electrophoresis (2-DE; described in detail in the Bio-Rad Applications & Technologies section), gels can be processed for protein detection via total protein staining and/or western blotting. Western blotting analysis following 2-DE separation is particularly useful in at least two important applications: (1) identification of pathogen-derived proteins that are highly immunogenic (have potential as vaccine candidates), and (2) evaluation of the range of host cell protein (HCP) impurities detectable by polyclonal antibodies used to monitor HCP impurities in purified biopharmaceuticals. For both applications, it is critical to generate a match rate from an overlay of the 2-DE and western blotting analyses. Bio-Rad’s PDQuest 2-D analysis software can be used to easily generate match rates. We describe here, step-by-step guidelines for generating this information using PDQuest software.
Guidelines for Match Rate Generation
Capture images using Bio-Rad’s ChemiDoc™ MP imaging system. Generate images using exposure times that give good image quality without saturation. For imaging the blot, create a custom protocol for chemiluminescence using 1 x 1 binning. Use the same zoom settings for imaging both the fluorescent stain and the chemiluminescent western blot.
Use Image Lab™ software to crop both images to the edge of the membrane. If necessary, first rotate each image so that the edges of the membrane are parallel with the frame of the image. This will ensure that the stained blot image and the western blot image are in register for PDQuest software analysis. Export the images for analysis (File>Export>Export for Analysis).
Launch PDQuest software. Open both of the files exported from Image Lab software.


